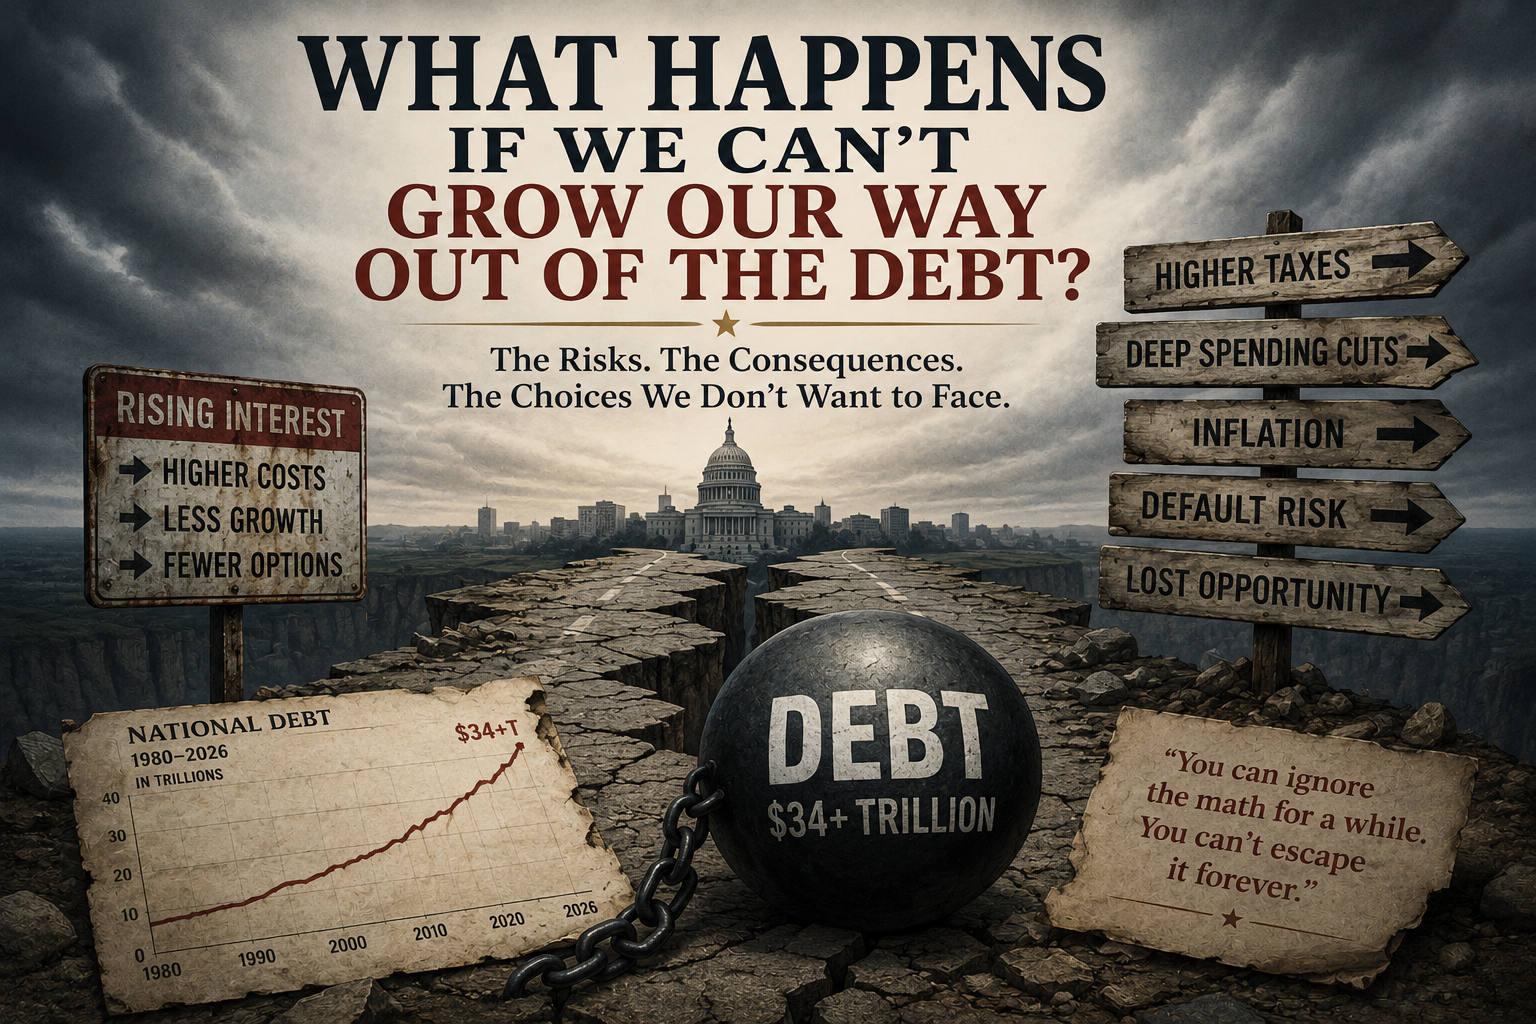
Every political conversation about the national debt eventually arrives at the same reassurance. Do not worry about the $39.8 trillion. The economy will grow. Growth generates tax revenue. Tax revenue closes deficits. The debt-to-GDP ratio comes down on its own as the denominator gets larger. That argument has worked at various points in American history. After World War II the ratio was nearly 119 percent of GDP, and the postwar economic boom drove it down to approximately 31 percent by 1981 without any dramatic fiscal austerity. The growth argument is not invented. It is historically grounded. What it is not is guaranteed, and the conditions that made postwar growth powerful enough to handle postwar debt are not the conditions that exist in 2026. The question worth asking plainly is what happens if the growth does not materialize at the scale the optimists are counting on. The answer involves a short list of outcomes and none of them are comfortable. Understanding them is not doom-saying. It is what paying attention to the numbers actually requires.
The Math That Has to Work
For debt to be sustainable without either raising taxes or cutting spending, the economy's growth rate must exceed the interest rate on the debt over time. When growth exceeds borrowing costs, the debt ratio shrinks even without running surpluses, because the economy expands faster than the debt compounds. When borrowing costs exceed growth, the opposite happens: the debt compounds faster than the economy grows, the ratio increases even if you hold spending constant, and you are on a trajectory that gets worse each year without a policy correction. Economists call the gap between these two rates the r-minus-g problem, where r is the real interest rate on debt and g is the real GDP growth rate. When r is greater than g, debt dynamics are unstable without fiscal adjustment.
The current numbers are not favorable. The United States is paying an average interest rate on its debt that has risen substantially from the near-zero rates of the 2010s, and the CBO projects the federal deficit will reach $1.9 trillion in fiscal year 2026 and grow to $3.1 trillion by 2036 under current policy. The economy has been growing, but not at a pace that comes close to closing a gap of that size. The ratio of debt to GDP at 122 percent is already in territory that the academic and institutional literature identifies as a drag on growth rather than a manageable burden. The Bank for International Settlements, in a widely cited 2011 paper by Cecchetti, Mohanty and Zampolli, found that public debt above 85 to 90 percent of GDP is associated with negative consequences for long-run growth. At 122 percent, the United States is already operating in the zone where the debt itself tends to suppress the growth that would otherwise help manage it.
Economists Carmen Reinhart and Kenneth Rogoff's landmark 2010 paper "Growth in a Time of Debt" found, across a dataset of 44 advanced and developing economies, that countries with debt above 90 percent of GDP experienced meaningfully lower growth rates than those below that threshold. The paper has been challenged methodologically in subsequent research, and some economists dispute the precision of the 90 percent threshold. What the broader literature, including IMF working papers from 2014 and 2022, does support is the directional conclusion: high public debt tends to crowd out private investment by pushing up interest rates, which reduces capital accumulation and drags on long-term growth. The United States at 122 percent is well above any threshold in the contested range, meaning the debate over where exactly the slowdown begins does not change the practical conclusion that it is already likely operating.
Scenario One: The Japan Path, Slow Stagnation
Japan is the scenario American policymakers most often point to as evidence that high debt is manageable indefinitely. Japan's debt-to-GDP ratio exceeds 250 percent, making ours look modest by comparison, and Japan has not experienced a sovereign default or a debt crisis in the conventional sense. This is true. It is also true that Japan has experienced three decades of economic stagnation, demographic decline, persistent near-zero growth and a standard of living that has not risen meaningfully since the early 1990s. The Bank of Japan has had to keep interest rates at or near zero for much of that period because even a modest rise in borrowing costs would make Japan's interest payments catastrophic given the scale of its debt. Japan has essentially become a country managed around its debt rather than a country where fiscal policy serves economic goals.
The United States could follow this path. It has the advantage that the dollar is the world's reserve currency, which means there is structural global demand for U.S. Treasury bonds that provides a cushion Japan's yen does not have. But that reserve currency status is not a permanent gift. It is a trust relationship built on the perception that the United States is a reliable borrower with manageable fiscal trajectories. Capital Group's institutional analysis notes that if the dollar's reserve currency status erodes because of fiscal unsustainability, the United States would lose the privilege of borrowing unlimited amounts at some of the world's lowest interest rates, and the impact of that loss could last for decades. The Japan path is the best of the bad outcomes. It is still a path to a country that has traded its economic dynamism for the ability to service debt that it built over decades of spending it did not have.
Scenario Two: The Interest Rate Spiral
The more acute risk is what the Committee for a Responsible Federal Budget described in its January 2026 analysis as an interest-debt spiral. The mechanism is straightforward: higher debt leads to higher interest rates as investors demand more compensation for the risk of holding U.S. bonds. Higher interest rates increase the annual interest payment on the existing debt. A larger interest payment means a larger deficit, which requires more borrowing. More borrowing increases the debt. Higher debt leads to higher interest rates. The loop closes on itself and accelerates.
Ray Dalio, the founder of Bridgewater Associates and one of the most widely cited analysts of historical debt cycles, described this mechanism in early 2025 writing that when debt service costs become intolerable, central banks face a choice that has no good option. If the Federal Reserve prints money to buy U.S. Treasury bonds and keep interest rates artificially low, it risks severe currency devaluation and inflation. If it allows interest rates to rise to market levels, it risks a severe economic contraction because borrowing costs across the entire economy rise with them. Dalio called this a "doom loop" in which the government is, in his words, "damned if it does" print money and "damned if it doesn't." The United States has not reached the point where this choice is forced. The annual interest payment crossing $1 trillion is the first visible marker that the trajectory is moving in that direction faster than the growth rate is compensating.
When debt service costs become unsustainable, the Federal Reserve faces a choice: print money and get inflation, or allow rates to rise and get recession. Ray Dalio calls this the doom loop. The United States is not in it yet. The $1 trillion annual interest payment is the first clear sign that we are moving toward it.
Scenario Three: Inflation as a Stealth Default
Countries that borrow in their own currency are never technically required to default because they can always print money to pay their obligations. The United States is in this category. But printing money to service debt is not a free lunch. It is what economists call a stealth default through inflation, because it reduces the real value of the debt by reducing the purchasing power of the currency in which it is denominated. Every creditor who holds U.S. Treasury bonds gets paid back in dollars that are worth less than the dollars they lent. That is a real loss even if no technical default occurs.
Capital Group's analysis of U.S. debt sustainability describes this scenario directly: if the Federal Reserve allows inflation to run above its 2 percent target to reduce the debt burden, that path is only effective for a short window before inflation expectations adjust upward, at which point interest rates rise to compensate lenders for the expected inflation and the debt burden becomes larger in nominal terms even as it is being eroded in real terms. Italy pursued this strategy after World War II, allowing high inflation to manage its debt load. The result was currency depreciation, investor flight and stagflation that led to poor living standards and rising unemployment. The American version of this path would involve a persistently weaker dollar, which raises the cost of every imported good, reduces the real wages of American workers and erodes the standard of living in ways that are politically invisible in the short term and economically damaging in the medium term.
Scenario Four: The Bond Market Breaks
The most severe acute scenario is a loss of confidence in the U.S. bond market of the kind that the CRFB described in its January 2026 analysis as a fiscal crisis. The United States currently benefits from the fact that U.S. Treasury bonds are treated globally as the world's safest financial asset. That status means there is reliable demand for American debt even at relatively low interest rates, which is what makes the current level of borrowing as manageable as it currently is. But as the CRFB noted, investor confidence can shift quickly. A panic in the bond market, triggered by a debt ceiling crisis, a credit rating downgrade, a geopolitical shock or simply the accumulated weight of years of unsustainable fiscal trajectories becoming too obvious to ignore, could produce a rapid rise in yields that forces a fiscal adjustment under emergency conditions rather than through deliberate policy choice.
Greece is the reference case for what a bond market crisis looks like in practice. Greece's debt-to-GDP ratio rose from approximately 108 percent in 2008 to 174 percent in 2014 as the financial crisis hit and the economy contracted. Yields on Greek government bonds spiked to levels that made new borrowing prohibitively expensive. The government was forced into emergency austerity measures, pension cuts and structural reforms under pressure from the IMF and European Central Bank as the price of continued access to credit markets. Unemployment reached 28 percent. The economy contracted by approximately 25 percent over five years. The United States is not Greece for several reasons: it issues debt in its own currency, it has deeper capital markets, it has stronger institutions and it is a much larger economy. But Greece demonstrates what happens when the bond market decides a country's fiscal trajectory is unsustainable and acts on that judgment faster than the country's political system can respond.
Japan: debt above 250% of GDP, near-zero interest rates maintained for three decades to avoid fiscal collapse, three decades of economic stagnation, demographic decline and flat living standards since the early 1990s. Greece: debt crisis from 2010 to 2018, 25% economic contraction, 28% peak unemployment, forced pension cuts and austerity, bailout conditions from IMF and ECB. Argentina: defaulted in 2001, 2014 and 2020, hyperinflation, mass poverty and capital flight. The United States has structural advantages none of these countries had. Reserve currency status, deep capital markets and institutional strength provide a substantial buffer. That buffer is not infinite. It has been shrinking as the fiscal trajectory has worsened and the annual interest cost has passed $1 trillion.
What the Reserve Currency Advantage Actually Buys
The strongest argument for American exceptionalism on the debt question is reserve currency status. Approximately 58 percent of global foreign exchange reserves are held in dollars as of 2024, according to IMF COFER data. This creates structural demand for U.S. Treasury bonds that makes American borrowing costs lower than they would otherwise be, allows the United States to run larger deficits than other countries could sustain and provides a genuine buffer against the kind of bond market crisis that would hit a smaller economy much faster. This is real. It is not a fantasy.
What it is not is permanent or unconditional. The dollar's share of global reserves has been declining gradually from approximately 72 percent in 2001 to 58 percent today. BRICS nations have been actively pursuing mechanisms to conduct trade outside the dollar system, with limited but real success. A sufficiently severe fiscal crisis or a sustained period of above-target inflation eroding the dollar's purchasing power would accelerate that shift in ways that would make future American borrowing significantly more expensive. IE Business School's analysis of U.S. debt sustainability puts it plainly: the worst long-term impact of a fiscal crisis would be the blow to global trust in the United States as a safe haven. For decades, U.S. Treasuries have been seen as the world's safest financial asset. If that trust were lost, the impact could last for decades and would deprive the United States of the privilege of borrowing at some of the world's lowest interest rates. That privilege is what makes the current debt manageable. Losing it would make the debt unmanageable almost immediately.
My Bottom Line
The optimists are not wrong that growth can help manage debt. The United States has done it before and has real structural advantages that give it more runway than most countries would have at the same debt-to-GDP ratio. What the optimists are not accounting for honestly is the scale of growth required to close a structural deficit that the CBO projects will grow from $1.9 trillion in 2026 to $3.1 trillion by 2036 under current law, and the documented academic finding that debt at 122 percent of GDP tends to suppress the growth that would otherwise help manage it. The most likely near-term outcome is the Japan path: slow stagnation, constrained monetary policy, persistent deficits and a gradual erosion of the economic dynamism that distinguishes the United States from economies managed around their debt obligations. The tail risk is the bond market scenario in which confidence shifts faster than the political system can respond and the adjustment happens under crisis conditions rather than through deliberate choice. Neither of those outcomes is inevitable. Both of them are more probable than the political class's preferred assumption that growth alone will handle a problem that grew by $1 trillion every 750 days with no credible plan to change the trajectory.
The postwar economy grew fast enough to bring debt from 119 percent of GDP to 31 percent in thirty years. The conditions that made that possible, a manufacturing boom, a demographic surge, a world rebuilding from rubble that needed American exports, do not exist in the same form today. Counting on them to reappear is not fiscal policy. It is a wish.
Why This Matters to Ordinary Americans
None of these scenarios are abstract. Each of them translates into specific consequences for specific people. The Japan path means a generation of American workers whose wages grow slowly, whose job opportunities are constrained by an economy managed around debt service rather than growth and whose retirements are funded by a Social Security and Medicare system under increasing fiscal pressure. The inflation path means the grocery bill, the rent and the car payment cost more in real terms every year while wages fail to keep pace, which is precisely what 2022 and 2023 demonstrated at a smaller scale. The bond market scenario means sudden austerity imposed by market conditions rather than democratic deliberation, with all the distributional consequences that always fall hardest on the people with the least cushion to absorb them. The question of whether the United States grows its way out of the debt is not a question for economists and bond traders. It is a question about what kind of country the next generation inherits. The answer depends on whether the current generation and its political representatives are willing to have a conversation that both parties have been avoiding for forty years.
References
- Committee for a Responsible Federal Budget. (2026, January 22). What would a fiscal crisis look like? crfb.org. [Interest-debt spiral mechanism; Argentina, Greece, Brazil historical cases; bond market confidence risk.]
- Reinhart, C. & Rogoff, K. (2010). Growth in a time of debt. American Economic Review: Papers and Proceedings, 100 (2), 573-578. [90% GDP threshold associated with lower growth across 44 economies.]
- Cecchetti, S., Mohanty, M. & Zampolli, F. (2011). The real effects of debt. Bank for International Settlements Working Paper No. 352. bis.org. [Public debt above 85-90% of GDP associated with negative growth consequences.]
- IMF Fiscal Affairs Department. (2022). Public debt and real GDP: Revisiting the impact. IMF Working Paper WP/22/76. imf.org. [High debt crowds out private investment; drags on long-run growth.]
- Congressional Budget Office. (2025). Long-term budget outlook. cbo.gov. [$1.9T deficit FY2026; $3.1T by 2036 under current law.]
- Capital Group. (2025, September). What happens if U.S. debt becomes unsustainable? capitalgroup.com. [Four paths; reserve currency status; inflation as stealth default; Italy historical case.]
- IE Business School. (2024, July). U.S. debt spiral: A looming threat to global economic stability. ie.edu. [Reserve currency trust; consequences of losing safe-haven status.]
- Dalio, R. (2025, January). How countries go broke: Chapter four and chapter five. Post on X (formerly Twitter). [Doom loop mechanism; central bank damned-if-it-does/doesn't choice.]
- IMF COFER Database. (2024). Currency composition of official foreign exchange reserves. imf.org. [Dollar share of reserves: 58% in 2024, down from 72% in 2001.]
- U.S. Fiscal Clock. (2026, July). US national debt by president. usfiscalclock.com. [$39.8T total; 122% of GDP; $1T+ annual interest; $1T added every 750 days.]
Disclaimer: The views expressed in this post are the personal opinions of the author and are offered for educational, commentary and public discourse purposes only. They do not represent the positions of any institution, employer, organization or affiliated entity. Nothing in this post constitutes legal, financial, medical or professional advice of any kind. Economic projections and scenarios described are based on publicly available academic research, institutional analyses and historical cases cited above, and represent possible outcomes rather than predictions. Readers are encouraged to consult primary sources and form their own conclusions.