
The first piece in this series argued that Democrats gave minorities decades of programs without delivering broad ownership, and pointed to the overall racial wealth gap as the evidence. This piece takes that argument down to the single asset that does more to build or block household wealth than any other: the house. For most American families, the front door is also the entrance to the wealth-building system. A home is shelter, but it is also forced savings, collateral, an inflation hedge and an asset that can be passed to the next generation. That is why the racial homeownership gap is not merely a housing statistic. It is one of the machines producing the wealth gap.
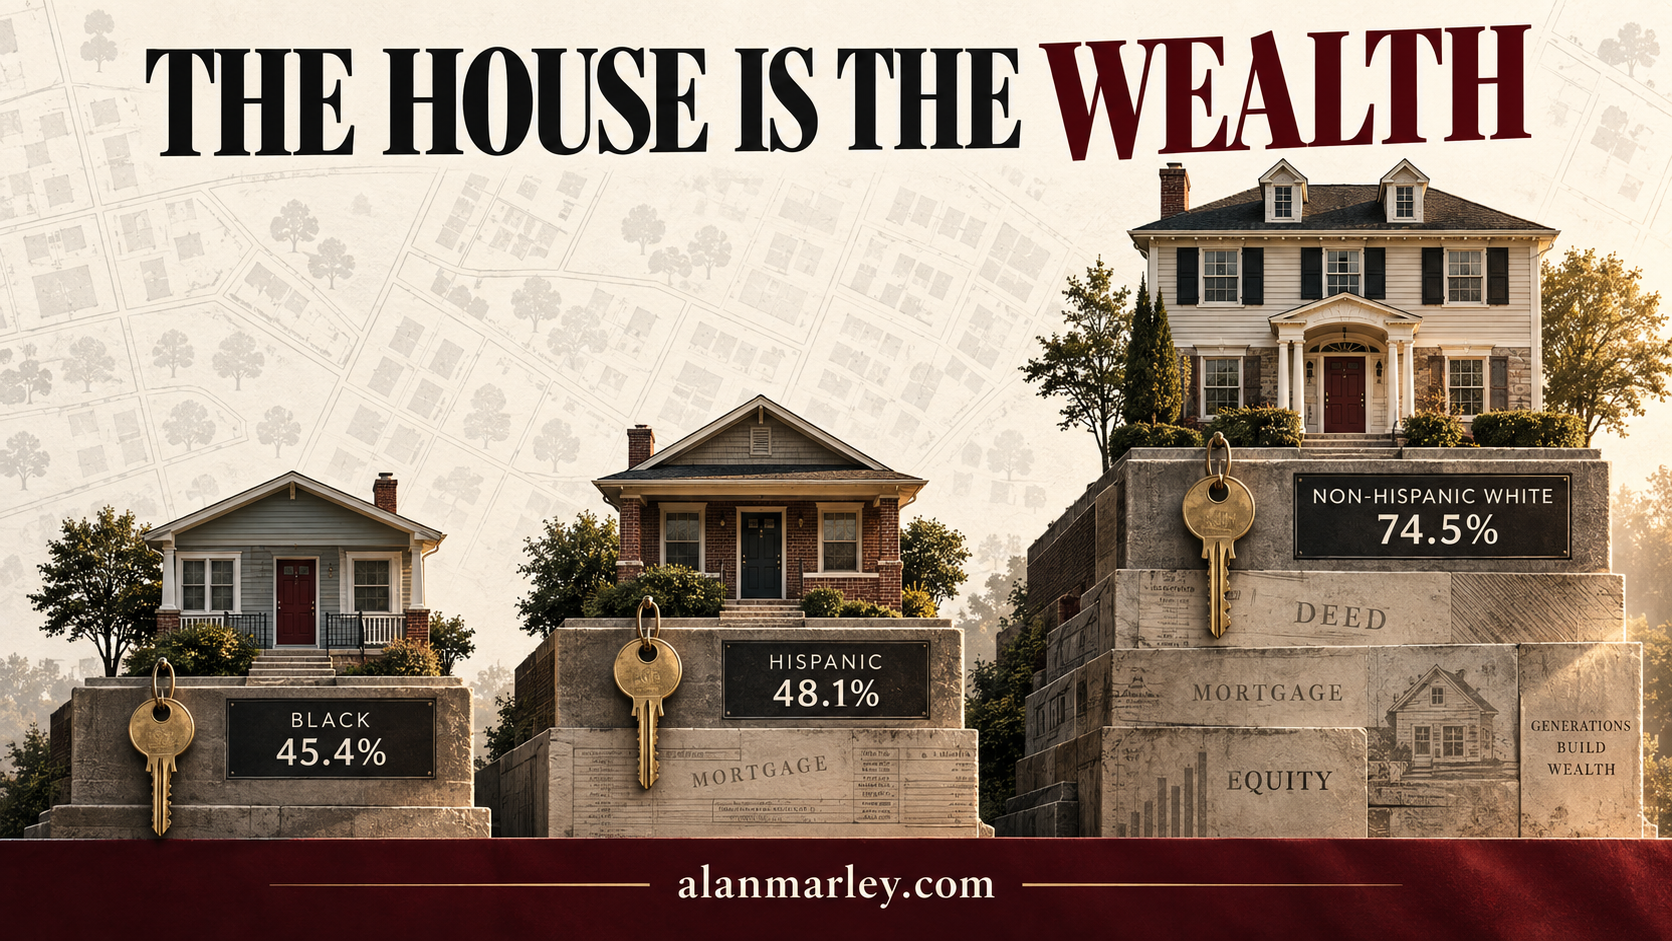
The latest national figures are stark. In the second quarter of 2026, 65.0 percent of U.S. households owned their homes. The rate was 74.5 percent for non-Hispanic White households, 45.4 percent for Black households and 48.1 percent for Hispanic households. That leaves a 29.1 percentage point White-Black gap and a 26.4 point White-Hispanic gap. These quarterly estimates have margins of error, but gaps this large are not statistical noise. They describe millions of families who either participate in housing appreciation or pay rent while somebody else does.
But the ownership rate is only the first number. A more serious examination has to ask four questions. Who owns? Where are the homes? What are those homes worth? And how much equity survives after the mortgage is subtracted?
Those questions reveal why two families can both be called homeowners while receiving very different economic returns.
The National Gap Is Large, and Persistent
Black and Hispanic homeownership has improved at different points in recent decades, but neither group has approached the White rate. The Federal Reserve's 2022 Survey of Consumer Finances found homeownership among 46.3 percent of Black families and 51.1 percent of Hispanic families, compared with 73.2 percent of White families. Different surveys use different samples and definitions, so their percentages should not be mixed as though they came from one table. Yet they tell the same broad story. White families remain much more likely to own a primary residence.
That difference compounds. The renter does not merely miss one year of appreciation. The renter misses the appreciation on prior appreciation, the gradual reduction of mortgage principal, the ability to borrow against equity and the chance to transfer an asset to children. Homeownership is not guaranteed wealth. Homes require maintenance, taxes, insurance and sometimes lose value. But long-duration ownership has historically been the most accessible leveraged asset available to middle-income Americans.
Where Are the Neighborhoods?
There is no single Black housing market or Hispanic housing market. National averages combine neighborhoods with radically different prices, job markets, tax burdens, insurance costs and growth prospects.
Black homeowners are geographically dispersed, with important concentrations in the Southeast and Mid-Atlantic, including the Atlanta, Birmingham, Memphis, Baltimore and Washington regions, in older industrial metros such as Detroit, Cleveland, Chicago and St. Louis, and in suburban communities throughout the Northeast and South.
Hispanic homeowners are heavily represented in the Southwest, Texas, California, Arizona, Nevada, New Mexico and Florida, as well as long-established communities in New York-New Jersey and Chicago. Think of the Los Angeles-Inland Empire corridor, Phoenix and Las Vegas, Albuquerque and El Paso, San Antonio, Houston and Dallas-Fort Worth, and South and Central Florida.
These are demographic patterns, not interchangeable markets. A $350,000 house in San Antonio, a $350,000 house in suburban Chicago and a $350,000 house in California may face completely different prospects for appreciation, insurance, taxes, employment access and resale demand.
The Homes Do Not Carry the Same Values
Redfin's analysis of home values at the end of 2024 classified census tracts by the race or ethnicity of a majority of owner-occupants.
Redfin estimated $276,000 in majority-Black neighborhoods, $395,000 in majority-Hispanic neighborhoods, $511,000 in majority-White neighborhoods and $559,000 in neighborhoods with no racial majority.
Total home value came to approximately $1.5 trillion in majority-Black neighborhoods, $2.0 trillion in majority-Hispanic neighborhoods and $40.4 trillion in majority-White neighborhoods. Those totals should not be misread as direct measures of how much wealth every racial group owns. They also reflect the number of homes in each category, and the categories describe neighborhoods, not the identity of every homeowner within them. Still, the enormous differences show where high-value residential property is concentrated.
The appreciation figures add nuance. During 2024, total home value increased 5.3 percent in majority-Black neighborhoods, 4.2 percent in majority-Hispanic neighborhoods and 5.4 percent in majority-White neighborhoods. Black neighborhoods were not universally stagnant. That year, their growth rate nearly matched White neighborhoods. Hispanic neighborhoods grew more slowly largely because so many are in Sun Belt markets, especially Texas and Florida, where prices softened after the pandemic-era building boom.
This matters because national racial comparisons often confuse race with geography. Houses appreciate in local markets, not in national demographic categories.
Market Value Is Not the Same as Equity
A $400,000 home with a $350,000 mortgage does not create $400,000 in household wealth. It creates roughly $50,000 in gross equity before selling costs. Down payments, interest rates, refinancing, home-equity borrowing, maintenance and length of ownership all affect what the family actually keeps.
Among families that owned homes in 2022, the Federal Reserve estimated median net housing wealth, the home's value minus housing-secured debt, at about $205,370 for White families, $123,000 for Black families and $135,000 for Hispanic families.
Yet the same data show why the gap persists. Fewer families own, and those who do own typically hold less home equity.
Housing also carries more of the financial load for minority owners. Redfin, using Federal Reserve distributional data, estimated real estate represented 44.1 percent of Black household net worth and 61.6 percent of Hispanic household net worth, compared with 27.4 percent for White households. That concentration can accelerate wealth when home prices rise, but it also creates vulnerability when a local market falls, insurance becomes unaffordable or a disaster strikes.
Why the Gap Persists
No single explanation survives serious scrutiny. The outcome is produced by several forces interacting over time.
Income matters because mortgage qualification depends on stable earnings and debt-to-income ratios. Savings matter because even a low-down-payment loan requires cash for closing, moving, repairs and reserves. Age matters because homeownership rises sharply over the life cycle, and the Black and Hispanic populations have different age distributions from the White population. Family structure matters because two earners can qualify for and sustain more housing debt than one. Credit history, existing debt, local housing supply, zoning, property taxes and insurance premiums all affect the result.
Present-day choices matter too. Families decide whether to save, borrow, marry, relocate, maintain a property, refinance or sell. But choices are made inside markets with different incomes, prices, schools, crime rates, credit access, taxes and inherited resources. Treating the outcome as entirely structural erases agency.
What a Serious Homeownership Strategy Would Measure
Announcing a down-payment program is easy. Producing durable owners is harder. A credible strategy would track outcomes rather than dollars spent.
Homeownership rates by age and income, not race alone. Mortgage approval and pricing for similarly situated borrowers. The number of first-time buyers who remain owners after five and ten years. Net equity after mortgage debt, not just gross property value.
Foreclosure, tax-delinquency and forced-sale rates. Insurance and property-tax burdens. Rehabilitation of older homes and access to small-dollar mortgages. Construction of entry-level homes in job-rich areas. And whether inherited property has clear title and can be financed or transferred.
The objective should not be ownership at any price. Pushing marginal buyers into overpriced homes with thin reserves can manufacture foreclosures instead of wealth. The goal is sustainable ownership. A sound property, an affordable fixed payment, adequate emergency savings, clear title, reasonable insurance and enough time for principal reduction and appreciation to work.
The Deed Is Only the Beginning
The homeownership gap is real, large and economically consequential. But counting deeds is not enough. A family benefits only if the house is in a viable market, the debt is manageable, the property can be maintained and ownership lasts long enough for equity to compound.
If America wants to narrow its racial wealth gap, it cannot settle for helping more families buy. It has to help them buy well, remain owners and pass something valuable forward.
Why This Matters
The first piece in this series made a blunt claim. Democrats gave minority communities decades of programs and did not deliver ownership. Housing is where that claim stops being abstract and becomes a set of numbers anyone can check.
A down payment assistance check is a program. A family that holds a mortgage for fifteen years, pays it down and passes a paid off house to their children has built wealth. Those are not the same accomplishment, and government policy has spent far more energy producing the first than the second.
The homeownership gap did not stay this wide because housing assistance, fair lending enforcement and anti-discrimination law were worthless. It stayed this wide because none of those efforts were built to measure or produce durable equity. They were built to expand access at the moment of purchase. What happened in year three, year eight or year twenty of that mortgage was treated as someone else's problem.
That distinction has to become the standard if future housing policy wants different numbers a decade from now. The goal cannot be counting how many families received down payment assistance, homebuyer credits or first-generation loans. The goal has to be counting how many of those families still hold the deed ten years later, how much equity they hold free of debt and whether that equity gets passed to the next generation intact.
Government at every level, federal housing policy, state down payment funds and local zoning boards, should be judged by that second standard, not the first. A homeownership initiative that produces headlines about units financed but never tracks five and ten year retention is not a wealth strategy. It is a press release with a mortgage attached.
If narrowing the racial wealth gap is genuinely the goal, the next generation of housing policy has to stop measuring itself by participation and start measuring itself by the same yardstick every family already uses. Does the house end up paid off? Does the equity survive? Does something get passed down? Until policy adopts that standard, the gap this piece documented will still be here the next time anyone runs these numbers.
- U.S. Census Bureau. (2026, July 28). Quarterly Residential Vacancies and Homeownership, Second Quarter 2026. census.gov.
- Board of Governors of the Federal Reserve System. (2023, October 18). Greater Wealth, Greater Uncertainty: Changes in Racial Inequality in the Survey of Consumer Finances. federalreserve.gov.
- Redfin. (2025, April 9). Hispanic Home Values Top $2 Trillion, But Growth Lags Behind Other Groups as Sun Belt Housing Markets Soften. redfin.com.
- Urban Institute. (2020, February 21). Breaking Down the Black-White Homeownership Gap. urban.org.
- Associated Press. (2024, April 16). Home Values Rising in Detroit, Especially for Black Homeowners, Study Shows. apnews.com.